Decision guide
Backtesting Bias, Data Quality, and Slippage: A Practical Checklist
A practical guide to research design, point-in-time data, execution assumptions, overfitting, validation, and honest backtest reporting.
Direct answer
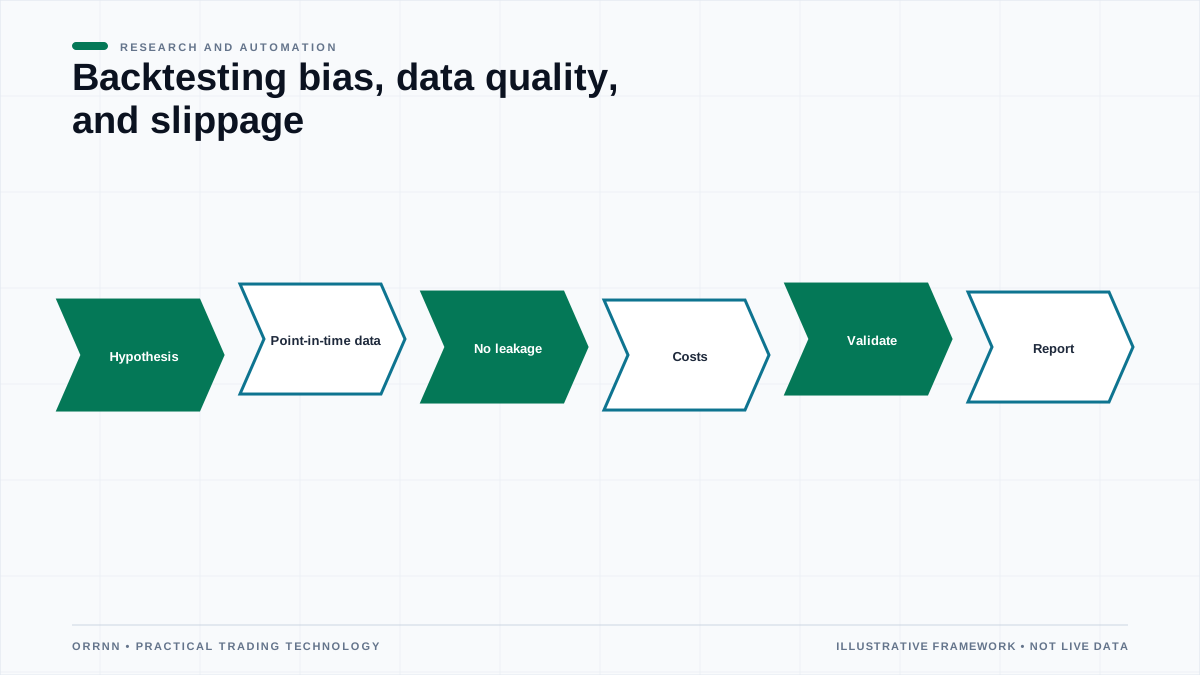
A credible backtest uses a predeclared hypothesis, point-in-time investable data, event timing that prevents future information, realistic costs and execution constraints, and validation that was not repeatedly optimized. Preserve failed trials, test sensitivity, separate research from final evaluation, and report uncertainty and limitations. A historical simulation is evidence about a model under stated assumptions—not a forecast or proof of profitability.
Write the research question before tuning the strategy
State the economic or behavioral hypothesis, target universe, signal, holding period, rebalance rule, portfolio construction, constraints, benchmark, data available at each decision, and evaluation measures. Define which choices are theory-driven and which will be estimated. A vague goal such as "find a profitable combination" invites repeated search until noise appears convincing.
Create a research protocol with development, validation, and final evaluation stages. Reserve data or time periods that will not guide parameter changes. If the result fails, preserve that trial in the experiment log rather than silently restarting with a new label. The relevant number of attempts includes discarded indicators, universes, transformations, filters, and sample periods—not only the final parameter grid.
Decide what would falsify the hypothesis and what magnitude could be economically meaningful after costs and uncertainty. This reduces the temptation to interpret any positive historical statistic as success. Strategy design and risk approval should also state unacceptable exposures, turnover, concentration, leverage, drawdown behavior, and capacity assumptions.
Create a data provenance record
For every field, record provider, dataset and version, collection method, timestamps, time zone, calendar, universe definition, corporate-action treatment, identifier mapping, corrections policy, missing-value rule, and access date. Preserve raw inputs or a reproducible snapshot where licensing allows. If a provider revises history, a future rerun can otherwise use information that was not in the original study.
Inspect coverage over time and by instrument. Count missing intervals, duplicates, zero or negative values where unexpected, crossed quotes, outliers, stale sequences, impossible volumes, and time-order violations. Visual inspection of samples is useful but insufficient. Automated quality rules need documented exceptions because markets can produce unusual but valid events.
Distinguish event time, exchange time, provider receipt time, storage time, and publication time. A fundamental figure associated with a quarter end was not necessarily public at quarter end. News, analyst, macroeconomic, and alternative datasets require point-in-time availability and revision history. The test must delay use until the strategy could actually have received and processed the value.
Checklist
- Dataset, vendor, version, license, and extraction date recorded
- Identifier history and universe construction are reproducible
- Time zones, calendars, daylight-saving rules, and timestamp meanings documented
- Corporate actions, delistings, symbol changes, and corrections handled explicitly
- Missing, stale, duplicate, outlier, and revised observations quantified
- Raw-to-clean transformations have tests and an audit trail
Prevent survivorship and universe bias
A present-day constituent list excludes many securities that failed, merged, delisted, or left an index. Testing historical signals on today's survivors can overstate returns and understate risk. Build the eligible universe using membership and availability as of each decision date, including delisted instruments and realistic exit handling when the strategy could have held them.
Selection bias also appears when a researcher chooses markets, periods, or data providers after seeing results. Record why the universe was chosen and report exclusions. Consider whether sufficient liquidity, borrow, market access, account permissions, and price data existed at the time. An instrument being present in a database does not mean it was investable under the proposed strategy.
Avoid applying current classifications, risk ratings, or corporate attributes backward unless they are genuinely point-in-time. Identifier mapping must handle reused tickers, mergers, share classes, redenominations, and venue changes. Review samples around corporate events because mapping mistakes can create extraordinary artificial returns.
Eliminate look-ahead and time-alignment errors
A strategy may use only information available before its decision and must trade no earlier than operationally possible. Bar data is a frequent trap: a signal calculated from a closing price cannot normally transact at that same close unless the strategy, order type, auction participation, and data timing support it. Use the next eligible event or a justified execution model.
Ensure features and labels do not overlap improperly. Normalization, volatility estimates, ranks, missing-value imputation, universe filters, and machine-learning transforms must be fitted using past data within each training window. Computing them once over the full dataset can leak future distribution information even when the price series itself is shifted.
Align markets with different hours, holidays, and time zones. A global daily row can accidentally combine one market's future close with another market's earlier decision. Corporate announcements and macro releases need actual publication timestamps and embargo handling. Test boundary cases around daylight-saving transitions and session breaks.
| Leak | Why it is misleading | Safer treatment |
|---|---|---|
| Current index members | Removes historical failures and departures | Point-in-time membership and delisting treatment |
| Trade at signal bar close | Uses a price known only as the signal completes | Next eligible event or justified auction model |
| Full-sample normalization | Future distribution affects past features | Fit transform inside each training window |
| Latest revised fundamentals | Later corrections overwrite what investors knew | Point-in-time vintages and publication lags |
| Best parameter chosen on test set | The test set becomes part of optimization | Lock a final evaluation set or use nested validation |
Model costs, slippage, and execution mechanics
Include commissions, platform or venue fees, spread, financing, borrow, taxes or duties where applicable, data or clearing costs relevant to the decision, and market impact. Costs vary by account, product, size, liquidity, venue, and time. Do not subtract a universal basis-point estimate without showing its source and sensitivity.
A fill model should use information available at order time and reflect order type, queue or priority limits, partial fills, cancellations, rejected orders, minimum quantities, price bands, session status, and latency. Bar data cannot reveal the intra-bar path or queue, so stop and limit fills based only on high and low values can be optimistic. Use higher-resolution data or conservative ambiguity rules when the strategy depends on intrabar execution.
Market impact grows with participation and liquidity conditions and can be nonlinear. Compare intended size with contemporaneous volume and depth where data supports it. Cap trades when the simulation cannot justify execution. Stress spread, delay, missed fills, and impact together; they may worsen at the same time during volatile periods.
For derivatives and leveraged products, model contract specifications, expiries, rolls, multipliers, settlement, funding, margin calls, liquidation rules, and price limits. Continuous futures series are useful for research but are not directly tradable; the roll construction and executable contracts must be represented. Short strategies need locate and borrow assumptions rather than unlimited availability.
Represent portfolio and accounting constraints faithfully
Simulate cash, positions, reserved funds, realized and unrealized profit or loss, fees, financing, collateral, and currency conversion in an internally consistent ledger. Orders should compete for limited capital rather than each assume the full account. Use the actual settlement, margin, and rebalance logic relevant to the proposed environment.
Position sizing must use lagged information and respect minimum lots, precision, notional minimums, concentration, leverage, and turnover constraints. Rebalance interactions can create trades that disappear when rounded or sequenced. Record rejected and unfilled target changes so the performance of the implemented portfolio can be compared with the idealized signal portfolio.
Choose a benchmark that matches the opportunity set and risk. Cash returns, financing, and currency can materially change a comparison across long samples. Report exposures over time—market, sector, factor, currency, duration, volatility, or other relevant dimensions—so apparent alpha is not simply an unacknowledged systematic bet.
Control overfitting and multiple testing
Every trial increases the chance of finding an attractive result by luck. Parameter heat maps, feature searches, universe choices, stop rules, and sample boundaries all count. Log the complete research path and distinguish confirmatory tests from exploration. A conventional significance value computed as if one strategy was tested is misleading after a broad search.
Prefer parsimonious models supported by an economic mechanism. Check whether performance is stable across reasonable neighboring parameters rather than concentrated at one optimum. Use regularization or complexity penalties where appropriate, and compare against simple baselines. Machine learning requires time-aware splits, fitting all preprocessing within training data, and avoiding leakage through labels, overlapping samples, or feature selection.
Methods such as the Deflated Sharpe Ratio and Probability of Backtest Overfitting were proposed to address selection and non-normal returns under stated assumptions. They can inform analysis but are not magic validators. Inputs such as the number and dependence of trials are difficult to estimate, and a corrected statistic does not repair biased data or unrealistic execution.
Use temporal validation and robustness tests
Split data in time order. Develop on earlier periods, tune using a defined validation process, and evaluate once on a held-back period when feasible. Walk-forward analysis can show how a repeated fitting rule would have behaved, but overlapping windows and repeated design changes still create dependence. Preserve the final holdout from human inspection until the research protocol permits it.
Test different regimes, venues, instruments, reasonable data providers, start dates, rebalance timing, and cost assumptions. Remove a small number of best trades, delay execution, worsen spreads, and perturb parameters. The aim is not to demand profit in every slice; it is to learn whether the thesis depends on a fragile artifact. Explain failures instead of averaging them away.
Bootstrap or simulation methods can describe uncertainty if dependence, non-stationarity, and sampling assumptions are appropriate. Time-series observations are not generally independent, so naive reshuffling can destroy important structure. Report confidence intervals or ranges with the method and limitations rather than offering a spurious precise forecast.
Separate research results from live expectations
A backtest is conditional on historical data and a model of implementation. Live performance adds data revisions, software defects, changing liquidity, strategy crowding, operational failures, different fees, unavailable trades, market adaptation, and human decisions. Use paper or shadow operation to validate data, signals, orders, reconciliation, and monitoring, while recognizing that simulated fills still do not recreate market impact.
Define a controlled launch with small limits, approved instruments, monitoring, kill criteria, and reconciliation. Compare live decisions with backtest expectations at each stage: input data, feature, target order, accepted order, fill, cost, and portfolio. Diagnose divergence before increasing risk. Do not change the model continuously in response to a few outcomes.
Set review triggers for data drift, missing feeds, cost changes, declining fill quality, exposure drift, drawdown, model error, operational incident, or hypothesis failure. A strategy can be operating correctly while losing money, and it can be profitable while controls are broken. Risk decisions should not rely on performance alone.
Report results so another person can challenge them
Show gross and net results, but do not lead with one ratio. Include return path, drawdowns and recovery, distribution, turnover, exposure, concentration, trade count, holding period, costs, capacity constraints, and performance by meaningful subperiod. State whether measures are annualized and how. Avoid charts that conceal scale, omit failed periods, or combine incompatible simulations.
This guide is educational and does not validate a strategy, forecast returns, or provide investment advice. Hypothetical results have inherent limitations and may differ materially from actual trading. Data rights, disclosure rules, and regulatory requirements vary by context. Obtain appropriate quantitative, risk, compliance, legal, and operational review before presenting or deploying a strategy.
Checklist
- Hypothesis, universe, decision timing, portfolio rules, and benchmark
- Data provenance, point-in-time treatment, cleaning, exclusions, and known gaps
- Complete experiment count and separation of development, validation, and evaluation
- Order, fill, cost, slippage, capacity, financing, and accounting assumptions
- Returns and risk with appropriate periods, exposures, turnover, and drawdown path
- Sensitivity to parameters, periods, instruments, costs, delay, and missing best trades
- Failed tests, exceptions, uncertainty, operational requirements, and limitations
- Versioned code, configuration, environment, and reproducible result artifacts
Primary sources and further reading
These sources support the frameworks and definitions used in this guide. They do not endorse Orrnn or establish that any product complies with the referenced material.
- The Probability of Backtest Overfitting
Journal of Computational Finance / SSRN authors' manuscript
Primary research proposing a framework for estimating backtest overfitting under its stated assumptions.
- The Deflated Sharpe Ratio: Correcting for Selection Bias, Backtest Overfitting, and Non-Normality
Journal of Portfolio Management / SSRN authors' manuscript
Primary research on adjusting Sharpe-ratio interpretation for selection and non-normal returns.
- CFTC Regulation 4.41 — Advertising by commodity pool operators, commodity trading advisors, and principals
Commodity Futures Trading Commission / eCFR
Primary U.S. rule text containing requirements related to hypothetical performance for persons and activities in scope; obtain legal advice on applicability.
- Data Analysis for Financial Markets: A Survey of Risks and Challenges
Board of Governors of the Federal Reserve System
Federal Reserve staff research discussing data and methodological challenges; it is research, not regulatory guidance.
Related reading
Trading bot VPS sizing
Size and operate the environment separately from evaluating strategy evidence.
Read →Measure broker-server latency
Replace a fixed latency assumption with a documented measurement and sensitivity range.
Read →Algorithmic trading overview
Review Orrnn's algorithmic-trading overview separately from this research methodology.
Read →