Decision guide
Trading Bot VPS Sizing Guide: CPU, Memory, Network, and Resilience
A measurement-led method for sizing a VPS for trading bots without relying on generic core, memory, or latency claims.
Direct answer
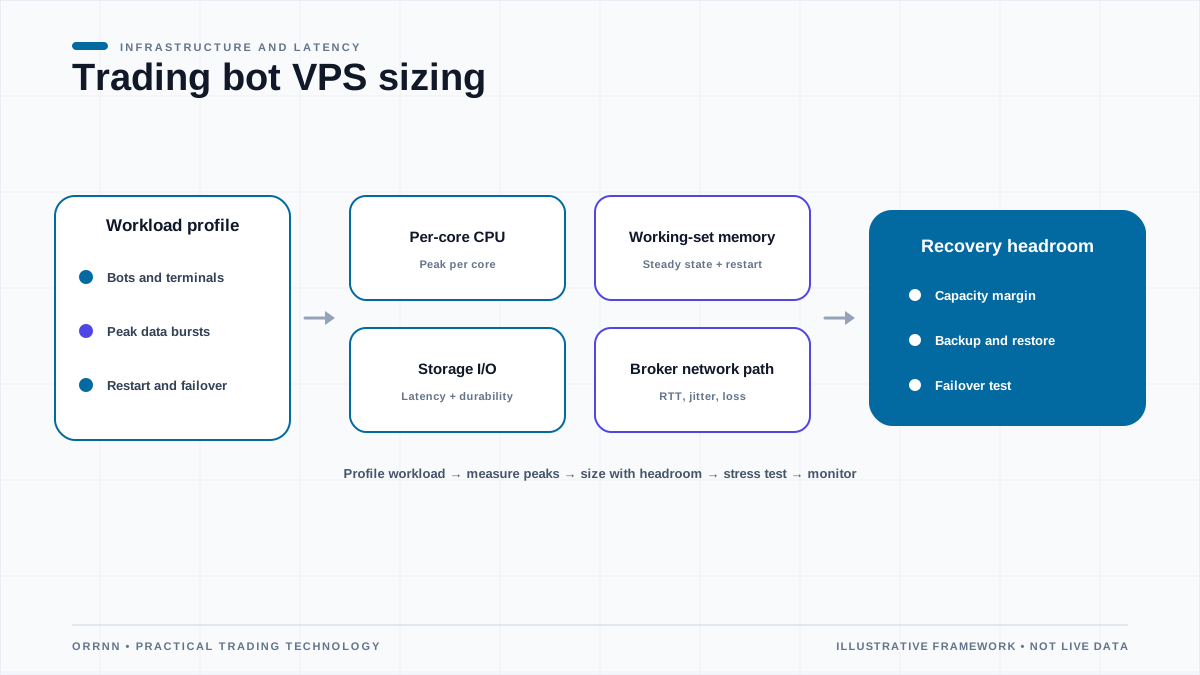
Size a trading-bot VPS from measured peak workload, not a universal recipe. Inventory terminals, strategies, symbols, charts, data feeds, databases, and monitoring; benchmark them together on the intended operating system; record CPU saturation, memory pressure, storage delay, network quality, and process pauses; then add explicit growth and failure headroom. The smallest instance that starts the software is rarely the safest production size.
Define the workload and service objective first
A bot that evaluates one bar-close strategy has a different profile from a multi-symbol strategy processing every tick, recalculating indicators, writing logs, and maintaining several broker sessions. List each terminal or service, strategy, symbol, time frame, subscription, chart, indicator, historical-data process, database, dashboard, antivirus or security tool, backup, and remote-access component. Note whether workloads peak together.
Define the service objective in terms the operator can observe: strategies remain connected during expected sessions, scheduled jobs complete before their deadline, order workflows remain responsive under a defined market-data burst, memory does not enter sustained pressure, and the system can recover using a tested procedure. Avoid promising profitable trading, zero downtime, or a fixed execution latency; infrastructure cannot control strategy quality, broker processing, venues, or the public network.
Classify the consequence of delay or failure. A research scraper, demo account, supervised discretionary tool, and unattended live strategy may warrant different monitoring, redundancy, and recovery. Confirm whether the broker permits the automation and connection pattern. Risk owners should approve live deployment and trading limits independently of server sizing.
Create a repeatable baseline test
Use the intended operating system, runtime, terminal version, broker connection, strategy configuration, security tooling, logging, and monitoring. Warm caches and load representative historical data. Run long enough to include session opens, news or other higher-rate periods where appropriate, scheduled tasks, log rotation, scans, backups, and reconnects. Short idle tests underestimate both resource demand and operational interruptions.
Capture per-process and system-wide metrics at a useful interval: CPU utilization by core, run queue, clock behavior if visible, memory working sets, commit or swap, page faults, storage latency and queue, bytes and packets, retransmissions, connection loss, and application event-loop or processing delay. Record bot-specific work such as events processed, calculation duration, rejected or delayed actions, and reconnects.
Version the test pack and preserve configuration, workload generator, dates, metric definitions, and raw results. Run at least one repeat to understand variance. Cloud hosts, shared virtual CPUs, software updates, and market conditions can change results, so a benchmark is evidence for a configuration and time—not a permanent property of an instance label.
Size CPU for peaks and single-thread constraints
Start by identifying whether the trading terminal or strategy can use several cores. Adding virtual CPUs may not help a latency-sensitive loop bound to one thread, while several independent terminals may scale across cores. Inspect per-core utilization and processing duration rather than only the machine average. A server showing 25 percent overall CPU on four virtual CPUs may still have one saturated core.
Measure peak windows and sustained busy periods. Look for increased processing delay, missed timers, queue growth, or pauses as CPU approaches saturation. Include encryption, network handling, logging, antivirus, monitoring, remote desktop, and operating-system tasks. Burstable instances may use credits or other policies; understand how sustained load changes available compute.
Choose a headroom policy based on variability, growth, and recovery. For example, the team might require a test load above forecast while keeping critical processing within its threshold, but no universal utilization target is safe for every runtime. Document the chosen threshold, why it is appropriate, and what alert or scale action follows.
| Resource | Evidence of pressure | Questions before scaling |
|---|---|---|
| CPU | Saturated core, queue growth, longer bot processing, credit exhaustion | Single-thread bound, parallel workload, pause, or noisy neighbor? |
| Memory | Rising working set, paging, allocation failure, process restart | Leak, cache, history depth, too many terminals, or insufficient RAM? |
| Storage | High latency or queue during logs, history, database, backup | IOPS, throughput, burst policy, file pattern, or competing task? |
| Network | Loss, retransmission, jitter, disconnect, throttling | Host path, broker endpoint, local stack, provider limit, or remote service? |
Size memory from committed working sets
Measure memory after terminals have loaded their normal symbol history, charts, indicators, strategy state, and caches. Include the operating system, security, monitoring, remote access, databases, and backup agents. Add the instances together, then observe whether memory continues to grow over hours or days. A leak or unbounded cache should be fixed rather than hidden indefinitely with a larger server.
Watch paging or swap behavior and application pauses, not only free memory. Operating systems use spare memory for caches, so low free memory is not automatically a problem. Sustained hard faults, swap input, slow process response, or out-of-memory events are stronger evidence. Understand runtime heap limits and whether a 32-bit process can use the available machine memory.
Model restart and recovery peaks. Loading history, compiling, starting several terminals, or reconnecting subscriptions can temporarily consume more memory than steady state. If the recovery process requires starting old and new versions together, include both. Preserve margin for updates and modest growth, then verify with an overload test rather than relying on arithmetic alone.
Treat storage as a latency and recovery dependency
Trading bots may write logs, tick or bar history, journals, databases, checkpoints, crash dumps, and backups. Estimate capacity from measured daily change, retention, updates, and temporary files. Set rotation and deletion rules so a full disk cannot unexpectedly stop the terminal or corrupt a database. Monitor both capacity and inode or file-count limits where relevant.
Storage performance is shaped by latency, IOPS, throughput, queue depth, block size, caching, and burst policies. Test the actual pattern while bots run; a sequential benchmark may not represent small synchronous log or database writes. Schedule scans and backups carefully and measure their impact. Do not disable security or backup permanently to improve a benchmark.
Separate recoverability from disk durability claims. Define which application state must be backed up, how credentials are protected, how often recovery points are created, and how restoration is tested. A disk snapshot taken while an application is writing may need application-aware steps. Replication can copy corruption or unwanted changes, so maintain an appropriate recovery history.
Measure network quality to the real broker endpoint
Geographic proximity can help, but test the actual broker endpoint from candidate regions and providers. Measure over representative sessions and report median and tail round-trip delay, variation, loss, route changes, disconnects, and application response separately. ICMP ping may be filtered or deprioritized and does not include broker processing; it is one diagnostic signal rather than an execution guarantee.
Check provider bandwidth and packet-rate limits, virtual-network design, public or private routing, firewall and network-address translation behavior, DNS, TLS, and any proxy. Market-data fan-out can consume more packets and application work than raw bandwidth suggests. Reconnection storms after an outage may create a more demanding pattern than steady state.
Avoid claims that a specific VPS location will always produce a certain execution time. The path can change, and order handling continues through broker gateways, risk systems, liquidity providers, and venues. Use infrastructure measurements to reduce an identified constraint, then validate order and execution timestamps only under an agreed methodology.
Account for virtualization and provider limits
Cloud and VPS instance names are not portable units of performance. Review processor generation where disclosed, virtual CPU model, dedicated or shared behavior, memory, network limits, storage attachment limits, burst credits, maintenance events, and availability options. Provider documentation often describes maximum or "up to" performance; confirm the conditions and benchmark your workload.
A noisy neighbor or host event can affect shared infrastructure. Use repeated tests, application telemetry, and provider status evidence before diagnosing it. Dedicated offerings can reduce some variability but do not eliminate software pauses, network events, or remote dependencies. Select an availability design based on the application state and recovery objective rather than marketing labels.
Confirm license, image, backup, snapshot, region, support, and data-transfer costs. A less expensive instance can become costly if it needs manual attention or frequent vertical scaling. Conversely, overprovisioning every bot can waste resources without improving risk. Tie capacity to measured thresholds and review it when strategies or terminals change.
Add resilience without duplicating orders
A standby bot is dangerous if both copies can act at once. Define active ownership through a reliable lease, fencing mechanism, broker-side identity rule, or another design appropriate to the platform. Heartbeats alone can create split brain when communication fails. Test how open orders, strategy state, positions, sequence information, and timers are reconstructed before enabling live failover.
Decide whether recovery means restart on the same server, restore elsewhere, warm standby, or active-active processing. Each has different complexity and recovery characteristics. Some retail terminals were not designed for simultaneous replicas, so their supported behavior must be confirmed. A manual, rehearsed failover can be safer than unproven automation.
Keep risk controls outside the bot where feasible, including broker or platform limits that remain effective if strategy logic fails. After recovery, reconcile account state before resuming. A missed signal is generally safer than an unintended duplicate economic action; the exact policy belongs to the strategy and risk owners.
Secure and operate the VPS
Use supported operating systems and applications, timely patching under change control, least privilege, strong remote access, protected credentials, host and network firewalls, malware defenses appropriate to the environment, encrypted administrative channels, and centralized monitoring. Restrict who can upload or change bot code and record deployments. Separate development artifacts and secrets from production.
Monitor process health, strategy heartbeat, last market-data event, last successful broker interaction, resource pressure, disk capacity, clock status, certificate expiry, backup completion, and suspicious access. Alerts need ownership, severity, suppression rules, and a response runbook. A green host metric does not prove the bot is processing correct market state.
Schedule updates and reboots, test compatibility, and maintain rollback. Record terminal, strategy, dependency, and configuration versions so an incident can be reconstructed. Time synchronization supports analysis, but changing a clock abruptly can affect timers and logs; use supported time-service configuration and monitor offset.
Use a sizing worksheet and state the limits
A simple planning total can add measured peak working sets and storage growth, but CPU and network capacity require workload tests because concurrency and burst behavior are nonlinear. Record a recommended configuration together with evidence, assumptions, threshold breaches, failure observations, and the next review trigger. Keep a smaller non-production environment only if it is clearly labelled and differences are understood.
This guide does not recommend a VPS provider or instance size, guarantee latency or uptime, or assess a trading strategy. Provider limits, broker endpoints, applications, and market conditions change. Test the exact configuration, use safe trading and account limits, and seek appropriate security and operational review before unattended live use.
- Inventory every process, bot, terminal, symbol, feed, database, monitor, scan, and backup.
- Capture a representative baseline and peak workload on the intended software stack.
- Record per-core CPU, process delay, memory pressure, storage latency, network quality, and bot outcomes.
- Multiply the test workload for forecast growth and a named stress scenario; do not merely multiply resource totals.
- Add headroom based on observed variability and the chosen recovery approach.
- Test restart, reconnect, backup, update, failover, and full-disk or dependency-failure behavior safely.
- Set alerts and review capacity whenever strategy, symbol set, terminal, provider, or region changes.
Primary sources and further reading
These sources support the frameworks and definitions used in this guide. They do not endorse Orrnn or establish that any product complies with the referenced material.
- Amazon EC2 instance network bandwidth
Amazon Web Services
Primary provider documentation illustrating that instance bandwidth depends on instance type and documented conditions.
- Virtual machine network bandwidth
Microsoft Azure
Primary provider documentation on expected aggregate network bandwidth and factors affecting throughput.
- Network bandwidth
Google Cloud
Primary provider documentation showing how machine, interface, direction, and configuration affect network limits.
- Network Time Protocol Version 4 — RFC 5905
RFC Editor
The standards-track specification for NTPv4; operational time architecture still needs platform-specific design.
Related reading
Measure broker-server latency
Use a layered method to evaluate candidate VPS locations and ongoing path quality.
Read →Backtesting bias and slippage
Keep infrastructure assumptions separate from evidence about a strategy's robustness.
Read →Virtual hosting architecture
Review Orrnn's hosting overview separately from this provider-neutral sizing method.
Read →