Decision guide
How to Measure Latency to a Broker Server
A reproducible method for measuring network, connection, API, and order-path latency to a broker endpoint without overstating the result.
Direct answer
Measure broker-server latency in layers: confirm the production endpoint and path, record round-trip delay and loss over representative periods, time DNS and connection setup separately, instrument authenticated API requests or protocol messages, and correlate client, broker, and execution timestamps where they are defined. Report distributions, tail values, failures, route, workload, and clock method. A single ping is not execution latency.
Define the latency question before collecting numbers
"Latency to the broker" can refer to several intervals: network round trip, DNS lookup, TCP connection, TLS handshake, application request and response, order acknowledgement, broker risk processing, routing to a liquidity provider or venue, execution, or delivery of the resulting report. Each has different endpoints and ownership. Name the start and end event, clock source, message, environment, account, and statistical summary.
For example, client-observed order acknowledgement might begin immediately before an application writes a complete order request and end when that application parses an acknowledgement. That interval includes local scheduling, serialization, network, gateways, broker processing, and return handling. It does not necessarily include an execution, and an acknowledgement may mean accepted for further processing rather than accepted by a venue.
Agree why the measurement is needed. Region selection, incident diagnosis, capacity planning, provider comparison, and strategy research require different tests. Set a decision criterion before seeing results and avoid turning an exploratory observation into a service promise. The broker should confirm which endpoint is supported and how its timestamps and status messages are defined.
Map the path and identify controlled boundaries
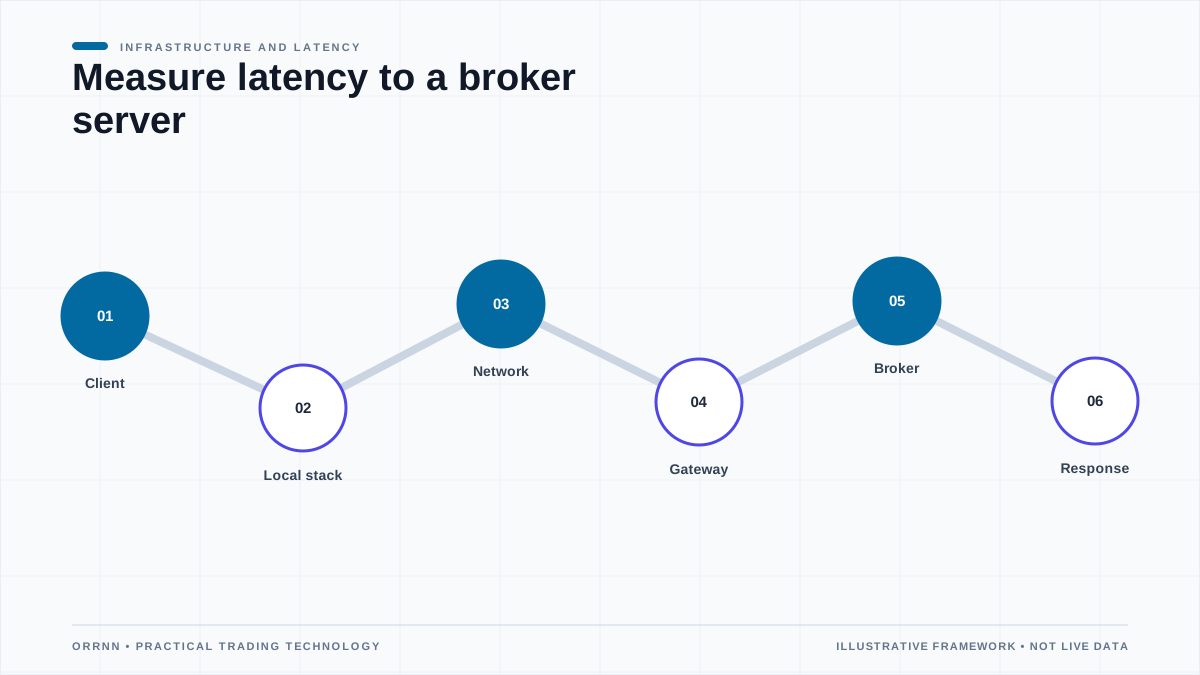
Draw the path from the trading process through its host, virtual network, firewall, address translation, internet or private connection, content or denial-of-service layer, broker gateway, application services, risk checks, router, counterparty, and venue where relevant. Not every hop will be visible. The map helps decide where to place measurements and which team can interpret a change.
Confirm the hostname, resolved addresses, port, protocol, region, production or test status, and whether anycast, load balancing, or geo-routing can change the destination. Record DNS answers and connection address with each run. Do not scan unapproved hosts or bypass the broker's supported endpoint; coordinate active testing and rate with the service owner.
Separate components you control from those you can only observe. Moving a VPS may reduce one network segment but will not guarantee broker processing or venue response. Similarly, a private circuit can improve path predictability while application queues remain the dominant delay. Instrument boundaries instead of assigning every change to geographic distance.
Prepare clocks and measurement instrumentation
Round-trip measurements made on one machine can use a monotonic clock and do not require clocks at both ends to agree. One-way or cross-system intervals require synchronized clocks, known accuracy, and timestamps captured close to the event. Wall clocks can step during correction and are vulnerable to time-zone or daylight-saving mistakes; use monotonic duration measurement inside an application where possible.
Monitor clock offset, synchronization source, leap behavior, and uncertainty. Record whether systems use NTP, PTP, provider time services, or another design. Nanosecond timestamp fields do not prove nanosecond accuracy. Queueing between a network interface and application can also separate a timestamp from the business event it is assumed to represent.
Instrument the client with correlation identifiers and timestamps around DNS, connect, TLS, write, first byte or message, parse, and state update. Preserve protocol status, payload class, response code, retry, connection reuse, and error. On a long-lived FIX or WebSocket connection, separate connection setup from message round trips. Keep measurement overhead small and quantify it where precision matters.
Use ICMP and path tools as diagnostics
Ping can estimate round-trip delay and loss for ICMP echo when the endpoint and network permit it. It is useful for comparing broad path conditions over time, but devices can filter, rate-limit, deprioritize, or respond differently to ICMP than to application traffic. No reply does not prove the trading service is unavailable, and a low reply time does not include the broker application.
Traceroute-style tools can reveal visible routing changes and where responses become slower, but individual hops may suppress or deprioritize diagnostic packets. A slow intermediate response followed by normal later hops often reflects control-plane handling rather than forwarding delay. Paths can be asymmetric, so the displayed outbound sequence does not fully describe the return route.
Run enough samples to show a distribution and use a conservative interval that will not burden the service. Record source host, region, provider, date, time, endpoint address, packet settings, tool version, and failures. Compare the same method across candidate hosts. Avoid choosing a location from one minimum observation.
| Measurement | Useful evidence | Does not prove |
|---|---|---|
| ICMP round trip | Reachable path delay/loss for diagnostic packets | API, order, execution, or market-data latency |
| TCP connect | Network plus TCP handshake to a named socket | TLS or application readiness |
| TLS handshake | Connection and cryptographic setup under the tested session state | Authenticated business processing |
| API round trip | Client-observed duration for a defined request | Venue execution unless the response semantics say so |
| Order event timestamps | Named lifecycle intervals if clocks and event definitions are sound | Causality or universal future performance |
Measure connection and application behavior
For short-lived HTTPS requests, measure DNS, TCP, TLS, request transfer, server wait, and response transfer separately where tooling allows. Test both new and reused connections because connection pools, TLS resumption, DNS caches, and proxies change the result. Make requests only through supported interfaces and use harmless operations or an approved test environment.
For persistent FIX or WebSocket sessions, monitor connection establishment, logon or authentication, heartbeat, message round trip, sequence gaps, reconnect, resubscription, and recovery. Choose a message with clear semantics and minimal economic risk. A protocol heartbeat demonstrates session liveness under its definition; it may not traverse the full business path used by an order.
Classify responses. A fast validation rejection, asynchronous acceptance, risk acceptance, venue acknowledgement, fill, and final application update are distinct outcomes. Compare like with like and preserve status codes or message types. Combining rejected and executed orders into one latency distribution can make a system appear fast while hiding the workflow users care about.
Build a representative measurement schedule
Collect across the sessions and conditions that matter to the intended workload: quiet periods, market opens or closes where relevant, scheduled maintenance, expected bursts, and reconnects. Respect provider policies and do not create artificial order traffic in live markets without explicit authorization and safeguards. Network-only or non-trading test messages are safer for frequent monitoring.
Run candidate locations concurrently when possible so market and broker conditions are shared. Ensure the test software, request, account class, connection mode, and sample window are comparable. Capture host resource pressure; a busy CPU, stop-the-world pause, exhausted connection pool, or swapping process can look like network latency.
Keep raw observations and a versioned test definition. Label exclusions and missing samples rather than silently removing them. If a timeout is excluded from a percentile calculation, report the timeout rate separately. A configuration with a lower median but frequent disconnections may be operationally worse than a stable alternative.
Report distributions and uncertainty
Report sample count, success rate, median, relevant percentiles such as the 95th or 99th, maximum with context, and variability over time. Percentiles need enough observations; an extreme percentile from a tiny sample is not stable. Use histograms or time series to show modes and incidents instead of compressing all behavior into an average.
Segment by endpoint, source location, protocol, operation, response outcome, connection reuse, market session, and version when those factors matter. State units consistently. Include the measurement boundary and any clock uncertainty. Do not use "latency" without a qualifier in a comparison table.
Network delay changes with routing, congestion, maintenance, attack mitigation, provider placement, and endpoint architecture. Results describe the observed test period. Repeat measurements and set alerts from a known baseline. A statistically different result may still be too small to affect the application; connect the threshold to an operational objective.
Checklist
- Named start and end events, environment, endpoint, protocol, operation, and outcome
- Clock method and uncertainty documented
- Source location, provider, host load, connection reuse, and route evidence captured
- Representative periods and adequate sample counts
- Failures and timeouts retained as outcomes
- Median, tail percentiles, variability, and sample count reported
- Results separated by response semantics rather than mixed indiscriminately
Investigate changes without jumping to a cause
When latency changes, confirm the measurement itself first: software version, endpoint, DNS answer, connection mode, clocks, host resource pressure, workload, and data completeness. Compare network diagnostics, connection phases, application timing, provider status, and broker notices. Look for the earliest layer where the change is visible.
Use controlled comparisons. If a second source region shows the same application delay but network round trip remains stable, the broker or shared dependency may warrant investigation. If only one host is affected and CPU queueing rises, local contention is plausible. These are hypotheses, not proof; collect corroborating telemetry and share timestamps and correlation identifiers with the responsible provider.
Avoid continuous route changes or server migrations in response to isolated spikes. Each change can alter security, failure modes, cost, and operational readiness. Use an incident threshold and require a post-change comparison under the same method. Roll back if the expected improvement does not appear or reliability worsens.
Relate network measurements to the order lifecycle
For an approved test or real order sample, define timestamps such as strategy decision, client send, gateway receive, risk completion, route send, venue or liquidity acknowledgement, execution, broker receipt, client receipt, and strategy update. Availability of these points varies. Confirm whether timestamps are generated by hardware, network interface, gateway, application, or database and whether clocks share a reliable time domain.
Break the total into intervals only when event definitions and clocks support it. Negative or impossible durations usually indicate clock, identifier, batching, or semantic problems. Partial fills, replaces, internalization, multi-venue routing, and asynchronous persistence make a single "execution latency" field misleading. Preserve order and execution identifiers so each event can be joined correctly.
Latency is only one execution-quality dimension. Price, spread, fill probability, rejection, partial fill, market impact, and opportunity cost may matter more. A faster route is not automatically a better client outcome. Any execution-quality analysis should be designed by specialists with appropriate data and regulatory context.
Apply a safe experiment and recognize the limits
The result should be a dated evidence pack, not a slogan: test question, topology, tools, versions, endpoints, sample windows, clocks, workload, exclusions, raw data, analysis, decision, and limitations. If the chosen location wins by a small and unstable margin, prefer the option with better reliability, support, security, or recoverability rather than claiming an absolute speed advantage.
This guide does not authorize probing, promise order or execution performance, or recommend a broker, host, route, or strategy. Measurement can affect systems and live orders can create financial risk. Coordinate with service owners, use approved environments and safe limits, and seek specialist review for execution-quality or regulatory conclusions.
- Ask the broker for supported endpoints, test methods, status semantics, limits, and maintenance information.
- Deploy identical measurement agents in candidate locations with synchronized configuration and monitoring.
- Collect non-invasive network and connection measures continuously at an approved rate.
- Run supported application probes and approved order-lifecycle samples separately.
- Store raw observations, failures, environment metadata, and configuration versions.
- Compare reliability and tail behavior as well as median delay and cost.
- Repeat after the selected deployment and monitor for material drift.
Primary sources and further reading
These sources support the frameworks and definitions used in this guide. They do not endorse Orrnn or establish that any product complies with the referenced material.
- A Round-trip Delay Metric for IPPM — RFC 2681
RFC Editor
A primary metrics specification defining round-trip delay measurement concepts and methodology considerations.
- Packet Delay Variation Applicability Statement — RFC 5481
RFC Editor
Primary guidance on selecting and interpreting delay-variation metrics.
- Transmission Control Protocol — RFC 9293
RFC Editor
The current standards-track TCP specification, useful for understanding what a TCP connection measurement represents.
- Network Time Protocol Version 4 — RFC 5905
RFC Editor
Primary NTPv4 specification relevant to clock synchronization; timestamp precision still must not be confused with accuracy.
Related reading
Trading bot VPS sizing
Use latency and reliability evidence as one input to a complete server sizing decision.
Read →FIX, REST, and WebSocket
Understand how protocol lifecycle and recovery change what a timing result means.
Read →Cloud architecture
Review Orrnn's cloud-network overview separately from this measurement methodology.
Read →