Decision guide
Forex Liquidity Explained: What It Is and How Brokers Measure It
Forex liquidity explained: what it means, how brokers measure spreads, depth, fill rates and slippage, and how liquidity reaches a broker's trading system.
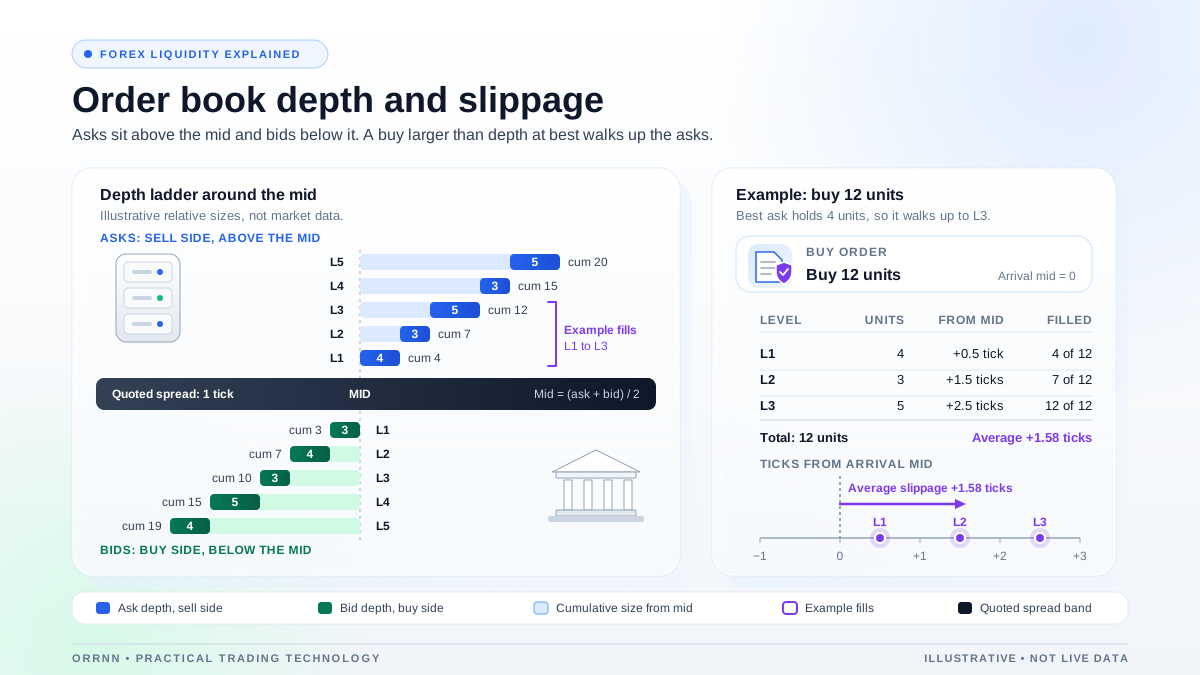
Direct answer
Forex liquidity is the ability to trade a currency pair in the size you need, at a price close to the current market, without moving that price. Brokers measure it with quoted and effective spreads, depth at the best prices, fill and reject rates, slippage against arrival price, and market impact, using their own order and tick data.
Key takeaways
- Forex liquidity is judged by cost, depth, execution quality and market impact together. No single number captures all four.
- Quoted spread is the displayed gap between bid and ask. Effective spread shows what a fill actually paid relative to the midpoint.
- Measure depth at the size you trade, including cumulative depth at realistic distances from the midpoint, not only the top of book.
- Fill ratio, reject rate and slippage come from your own order records, which show the outcomes clients actually receive.
- Thin conditions around news, rollover, weekends and holidays can move every metric at once, so measure them in separate segments.
What forex liquidity means in practice
Forex liquidity describes how easily a currency pair can be bought or sold at a price close to the current market, in the size a trader needs, without the trade itself moving that price. A liquid pair has many active buyers and sellers, tight pricing for normal sizes and enough resting orders that a typical fill lands near the quoted price. An illiquid pair shows wide prices, thin displayed size and fills well away from the screen price.
The scale of the global market is large. The Bank for International Settlements reported that over-the-counter foreign exchange trading reached $9.6 trillion per day in April 2025 on a net-net basis, up 28% from $7.5 trillion three years earlier. That survey covers the market as a whole. It does not show what a particular broker's feed offers in EUR/USD, which is why brokers measure their own liquidity directly.
Liquidity is also a property of the path between client and market. A pair can be deep among large banks and still feel thin on a retail platform if the price feed is narrow or the routing reaches only a few providers.
The liquidity metrics brokers measure
This guide uses eight measures. The table gives a standard formula for each and the question it answers. Treat the formulas as definitions to be written down, not as a fixed scorecard.
Document the midpoint, reference time, unit of size and sample window for every calculation. A spread logged a second before an order arrives can make a clean fill look expensive, so clock discipline matters as much as the arithmetic.
Core forex liquidity metrics and standard formulas
| Metric | Standard formula | What it tells the broker |
|---|---|---|
| Quoted spread | Ask - Bid. Relative form: (Ask - Bid) / Midpoint, where Midpoint = (Ask + Bid) / 2 | The posted cost at the top of the book |
| Effective spread | 2 x |Execution price - Midpoint|, with the midpoint taken at a stated reference time | The cost each fill actually incurred |
| Top-of-book depth | Size at the best bid + size at the best ask | How much trades before the price reaches the next level |
| Cumulative depth | Resting size within a set distance (pips or ticks) of the midpoint, per side | Whether the book supports the sizes clients place |
| Fill ratio | Filled volume / Requested volume | How much of the requested size was executed |
| Reject rate | Rejected orders / Orders submitted, also measured by volume | How often orders are refused, and why |
| Slippage against arrival price | Buy: Execution - Arrival. Sell: Arrival - Execution. Positive is adverse | The price move between order arrival and fill |
| Market impact | d x (Midpoint after N seconds - Midpoint at arrival), d = +1 for buys and -1 for sells. Positive is adverse | Whether the order itself pushed price against the client |
Read the metrics together, not one at a time
A tight quoted spread on shallow depth can fail a client who trades a larger ticket. A deep book with wide effective spreads suggests that markups, last-look behavior or internal routing are doing more work than the displayed prices show. Fill ratio and reject rate often reveal problems that a spread chart hides, especially during fast moves.
Segment before you average. Measure by instrument, session, order-size band and account type. An average across all majors and all hours can hide the few minutes around a scheduled release, where most of the damage happens. Where the data allows, look at high percentiles, because the typical fill and the worst fill tell different stories.
Keep the sample honest. A few hundred orders from a quiet week will not describe a volatile month. State the period, order count and volume behind each figure.
Tier 1 and tier 2 liquidity in industry usage
Trading desks often describe liquidity providers as tier 1 or tier 2. This is industry shorthand rather than a formal category, and firms apply the labels differently. In common usage, tier 1 refers to large banks and major market makers with broad two-way pricing. Tier 2 usually means smaller or more specialized providers, which may price some instruments well and carry thinner size in others.
The practical question is what a provider quotes for your instruments, sizes, hours and account types. A provider can be strong in majors and weak in exotic pairs. Ask for quoted size and spread history for each symbol you list, and confirm whether quotes are firm or indicative. A label on a sales deck is not a measurement.
How liquidity reaches the broker
Liquidity usually reaches a broker through three layers. A liquidity provider streams prices and accepts orders. A bridge or gateway connects the broker's trading system to one or more providers and translates their protocols. An aggregation layer combines quotes, decides where each order goes and applies the broker's pricing rules. Some brokers buy all three as one product; others assemble them from separate vendors.
MetaQuotes describes MetaTrader 5 for brokers as offering connectivity to exchanges and liquidity providers, along with Market Depth in the trading environment. Those are vendor statements about what the platform supports. They do not show which providers a particular broker has contracted or how it routes client orders.
Each link needs its own measurements. At the provider, track quoted size, firmness and rejects. At the bridge, track message delay, sequence gaps, reconnects and reconciliation breaks. At the aggregation layer, record which source filled each order and how often routing overrode the best available price. Without those records, a poor fill cannot be traced to a cause.
Thin-liquidity events that change every metric at once
Scheduled economic releases and central bank announcements are the best-known case. Providers may widen prices or cut displayed size beforehand, and the size that returns afterward may differ. Unscheduled news can produce the same effect with less warning.
Rollover is another. Spot FX positions held past a provider's daily cut-off are rolled, and swap pricing and the return of quotes can leave the book shallow for a short period. The exact timing depends on the provider and instrument, so confirm it in writing.
Weekend closure and reopening can create the widest gaps. Quotes may be indicative or absent when a market reopens. Public holidays, especially in a major trading center, can leave one region's liquidity shallow while the global market still appears open.
Measure these periods in their own segments so they do not disappear into an overall average. Then agree with your risk and compliance team how the platform should behave in those windows.
Build a measurement plan your data can support
A measurement plan starts with the data rather than the dashboard. If a broker cannot say when a quote arrived, which provider filled an order and what the midpoint was at arrival, its liquidity reporting is an estimate rather than a measurement.
Checklist
- Quotes, orders and fills timestamped from one controlled clock source, with time zones recorded
- Provider, bridge and routing decisions logged for every order
- Metrics calculated by instrument, session, size band and account type
- Midpoint, reference time and unit of size written down for every formula
- Reconciliation against provider reports, with the break rate reported
- Sample period, order count and volume stated beside every published figure
Limits, risk and what liquidity metrics cannot tell you
A liquidity report describes the conditions a broker observed on its own systems during a stated period. It does not guarantee the next fill, a stable spread or any profit or loss outcome. Forex and CFD trading can lose money quickly, and leverage magnifies both gains and losses.
The UK Financial Conduct Authority says CFDs are high-risk products that are not suitable for all retail consumers, and lists rolling spot foreign exchange among the CFD-type products its rules cover. The CFTC advises the public to research over-the-counter forex dealers before making initial deposits, including checking CFTC registration and the dealer's disciplinary history with the National Futures Association, which publishes that history through NFA BASIC. Those checks come before any comparison of liquidity or price.
Orrnn is a trading software architecture and engineering provider. It does not supply liquidity, hold licenses to deal, or give regulatory or legal advice. Questions about a broker's permissions and execution policy belong with qualified advisers and the relevant regulator.
Frequently asked questions
What is forex liquidity?
Forex liquidity is how easily a currency pair can be bought or sold at a price close to the current market, in the size needed, without a large price move. Liquid pairs show tight spreads and deep resting orders. Illiquid conditions show wide spreads, thin size and fills far from the screen price. Liquidity changes with the pair, the time of day, the venue and the news flow.
How do brokers measure forex liquidity?
Most brokers combine price and execution data. They track quoted and effective spreads, depth at the best prices and at set distances from the midpoint, fill and reject rates, slippage against arrival price, and short-term market impact. Each figure needs a defined midpoint, a reference time and a sample period, so results can be compared over time.
Does a tighter spread always mean better liquidity?
Not always. A tight quoted spread can sit on shallow depth, so a larger order may fill at worse prices. Effective spread, slippage and fill ratio show what a client actually paid and received. Commissions, swaps and fees sit outside liquidity metrics, so compare total cost for the order sizes you actually trade.
What is the difference between tier 1 and tier 2 liquidity?
Tier 1 and tier 2 are industry labels, not a formal regulatory category. Tier 1 usually describes large banks and major market makers with broad pricing. Tier 2 usually describes smaller or more specialized providers. The label matters less than the measured quotes, size and firmness for each instrument and account type a broker offers.
Why does forex liquidity drop around news and rollover?
Providers often widen prices or reduce displayed size before scheduled releases, and some pull quotes during unscheduled news. Around rollover and weekend reopenings, swap pricing and changing quote availability can leave the book shallow for a short time. Ask a broker or provider for its written rules on these windows.
Primary sources and further reading
These sources support the frameworks and definitions used in this guide. They do not endorse Orrnn or establish that any product complies with the referenced material.
- OTC foreign exchange turnover in April 2025
Bank for International Settlements
BIS Triennial Central Bank Survey release for FX turnover, including the April 2025 daily figure on a net-net basis.
- MetaTrader 5 for Brokers
MetaQuotes Ltd
Vendor description of broker features, including connectivity to exchanges and liquidity providers and Market Depth. It describes the vendor's offer, not any broker's configuration.
- Contracts for difference
Financial Conduct Authority
The FCA's expectations for providers of CFD products, including rolling spot FX, and its high-risk product description.
- Eight Things You Should Know Before Trading Forex
U.S. Commodity Futures Trading Commission
Customer advisory on researching over-the-counter forex dealers, including CFTC registration and NFA disciplinary history, before making initial deposits.
- NFA BASIC
National Futures Association
Public database for checking registration and disciplinary history. Its stated scope and limitations apply.
Related reading
What is a liquidity provider
The provider role, the quote types it offers and the questions to ask before connecting one.
Read →Liquidity providers
How Orrnn scopes and evaluates liquidity provider connections, and what those connections do not include.
Read →Liquidity bridge evaluation
Routing, risk and due-diligence questions for the bridge between a broker and its providers.
Read →Order routing for FX and CFD brokers
How routing rules, fills and rejects turn available liquidity into the outcomes clients see.
Read →Broker solutions
Orrnn's broker-facing overview. Orrnn does not supply liquidity or hold licenses.
Read →